
Mobile Products & Growth
User Retention in Mobile Apps and Games: Give People a Reason to Return
A practical guide to mobile app and game retention: improve the first experience, interpret D1, D7 and D30, and test meaningful reasons to return.
Updated: 2026-10-18
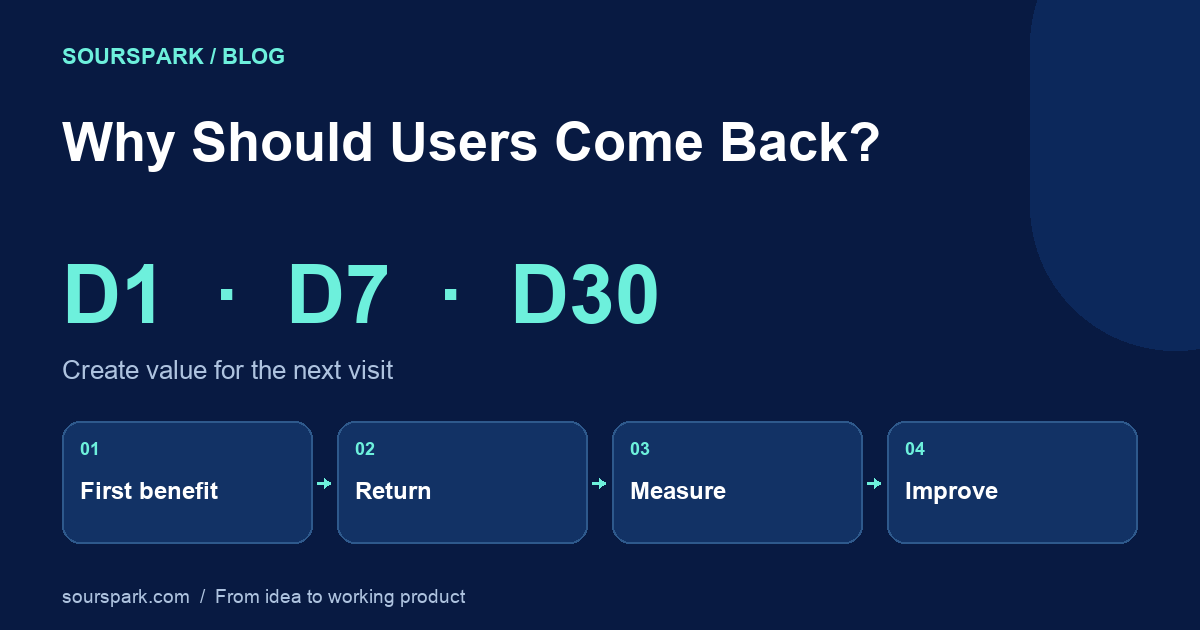
After the download, ask what value people experienced
Acquiring the first users is a beginning. Retention concerns whether those same people use the product again and find something useful when they return. A clear opening puzzle or a saved route in a travel app could demonstrate that value. These are product-design examples, not measured outcomes from SourSpark projects.
Avoid asking someone to complete a long registration, grant many permissions and learn every feature at once. Help them finish the main task first. Define a meaningful first action as activation, then investigate whether people who complete it return. Activation and retention answer different questions.
Build a reason to return that fits the product
Not every product needs daily use. Language practice might fit a daily routine, while a trip-planning app becomes useful when another journey approaches. Define success around the actual need. More unnecessary app opens do not demonstrate that someone is getting a better result.
Games can offer understandable progression, fair difficulty and a reliable way to resume. Apps can preserve work, make useful history accessible and reveal a relevant next step. Before adding rewards or streaks, explain why the core activity deserves repeating. Make returning welcoming rather than punishing someone for missing a day.
Use consistent definitions for D1, D7 and D30
In this guide’s example, D1 means returning on the first calendar day after initial use; D7 and D30 mean returning on the seventh and thirtieth days. Users who start on the same day form a cohort. Fix the timezone, starting event, return condition and identity method before calculating.
Suppose 40 of the same 200 starters return on D1, 20 on D7 and 10 on D30. The rates are 20%, 10% and 5%. These are illustrative numbers, not industry targets or real product results. D7 here does not mean returning at any point during the first seven days. Exact-day and time-window measures differ, and one person can count on multiple days.
Assess D30 only for cohorts with a complete thirty-day observation period. Do not count users whose thirtieth day has not arrived as lost. Tools can define the starting point, activity and identity differently; matching metric names do not guarantee comparable values.
Compare similar groups before trusting an average
Country, language, acquisition source, device and app version can conceal different experiences. Compare cohorts with similar starting dates rather than compressing all traffic into one average. If both the release and the advertising source changed, do not attribute the difference solely to design. A few people can move a small sample’s rate substantially.
GA4 cohort exploration separates inclusion criteria from return criteria. Apple’s usage data is limited by users’ data-sharing choices. Record report coverage, missing data and filters. Website traffic alone cannot establish in-app retention. Verify measurement on test devices without collecting unnecessary personal data.
Remove interruptions and protect trust first
Slow loading, lost progress, unexplained errors or repeated sign-in screens can make returning harder. Use event data to find where people leave, then investigate why through short conversations and real-device tests. A session ending does not prove dissatisfaction: someone may simply have finished their task.
Android’s quality guidance treats ad timing and frequency as part of the experience. In your experiment, review revenue alongside task completion, return behaviour and technical errors. If revenue grows while completing the useful action becomes harder, a revenue chart alone is not sufficient evidence of success.
Let notifications remind people of something useful
A notification should explain why it matters now and what the recipient gains. A requested study reminder or an update on a followed task might be relevant. An identical “come back” message sent to everyone cannot repair missing value inside the product.
Respect preferences, timing and frequency limits, and make notifications easy to disable. Do not optimize only for opens. Examine whether recipients complete the relevant task, return later and turn notifications off. Set an honest expectation instead of inventing urgency or promising a reward that does not exist.
Test one hypothesis and watch for side effects
Write one testable idea, such as “a shorter explanation in the opening level will help more people finish the first puzzle.” Choose the main outcome, observation period and metrics you do not want to worsen before starting. Record release issues, ad exposure and traffic quality.
Firebase A/B Testing supports evaluating product changes against outcomes such as retention. A one-day difference in limited traffic is not a dependable conclusion. When there is insufficient data, use structured user sessions to identify confusing steps, without presenting observations as statistical proof. A change can improve the first session yet add no reason to return.
Turn the first month into four practical steps
Repair measurement and one frequent obstacle before testing a reason to return. Changing registration, difficulty, notifications and advertising together makes it difficult to know which intervention mattered.
By the end of the month, aim for a testable explanation of which people return and why, rather than just a percentage. D30 will not yet be available for everyone acquired during that month; wait for each cohort’s observation period to mature. The goal is to make the product useful when people need it again, with a clear and comfortable path back.
- Week 1: Define activation and return; verify events, timezone and test-device handling.
- Week 2: Fix one first-use obstacle; monitor completion and D1 in comparable cohorts.
- Week 3: Test one reason to return; review D7 and side effects where observation is complete.
- Week 4: Check the finding again and plan the next experiment while cohorts mature for D30.
Frequently asked questions
What is a good D1 or D7 rate?
There is no single threshold for every product. Usage cadence, category, country, acquisition source and measurement definitions affect the result. Start with comparable cohorts in your own product and changes over time.
Are daily rewards and notifications enough?
No. They may not resolve a confusing first experience or a lack of recurring value. Validate the core experience and the need to return before testing rewards and reminders.
Is DAU/MAU the same as retention?
No. The relationship between daily and monthly active use does not, by itself, explain whether a specific starting cohort returned on D7. Examine cohort retention and usage frequency separately.
SourSpark
Understand why your users return.
Share your app or game, current user journey and measurement questions. Together we can build a practical plan for first-use improvements and lasting value.
Discuss my retention plan